Technical assurance
A dashboard total should survive the click
A dashboard saying twelve records need attention creates an expectation that its drill-down will explain those twelve. Keeping that promise is a domain and data-consistency problem as much as an interface problem.
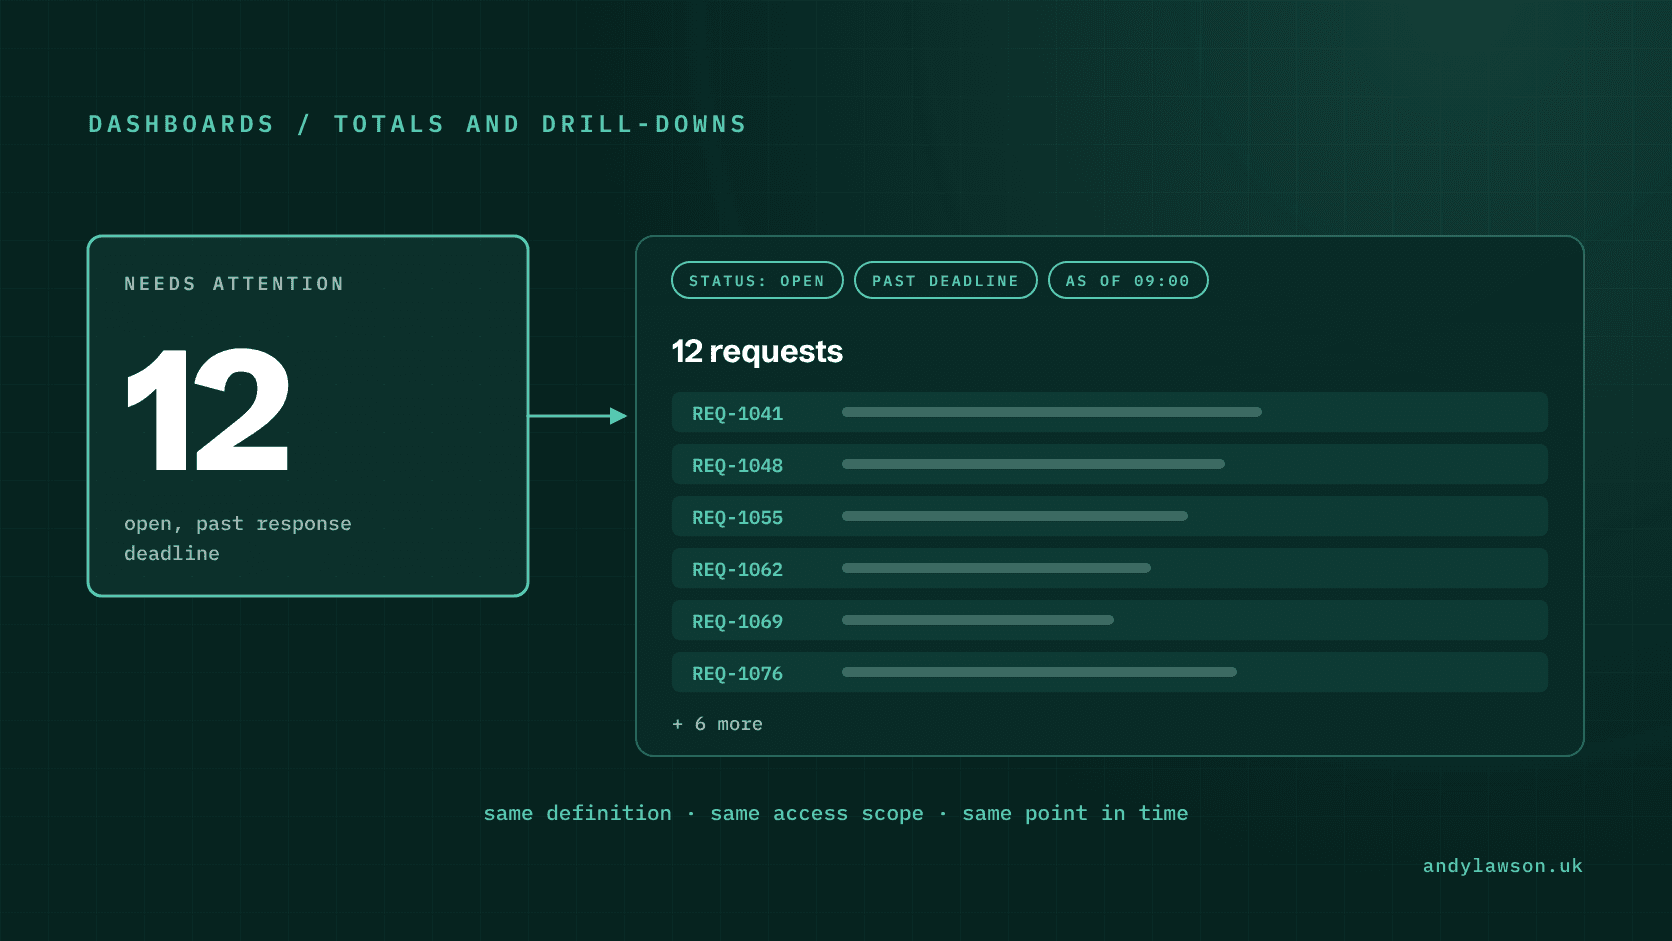
An operational dashboard says twelve requests need attention. The user clicks the figure and lands on a list of nine. Nothing explains the difference. The interface has turned an apparently useful summary into another reconciliation task.
The cause may be ordinary: a different filter, a stale cache, a permission boundary or a change made by another user. It's still a product problem. The number made a promise about the records behind it, and the application hasn't explained why it no longer holds.
I'd design a dashboard figure and its drill-down as two views of the same business question. That question needs a definition before it needs a chart.
Define the population behind the number
Start with a specific definition. Say a service-request application shows a figure labelled 'Needs attention'. That might mean open requests that have passed their response deadline and have no recorded resolution. Another team might expect it to include requests waiting for an external decision. Those are different populations.
Record the included and excluded states, the unit being counted and the relevant time rule. Does the figure count requests, outstanding tasks or customers affected? Can one request be counted more than once?
Make the detail query use the same definition. A dashboard count and a list filter maintained independently can drift while each passes its own tests. Share the domain rule or the underlying query contract, and test the relationship between their outputs.
Keep the definition short enough to explain in the interface. A label such as 'Open requests past response deadline' is more useful than a dramatic red number whose inclusion rules only a developer knows.
Carry the filter through the navigation
A click should preserve the meaning of the summary. Open the relevant view with its filters applied and visible. The user should be able to see why the records are present and remove a filter deliberately.
Represent shareable filters in the URL where appropriate, including the population, date range and sort order. Keep those separate from personal presentation preferences such as column widths. Copying a link should reproduce the business question without depending on the sender's browser storage.
Test the back button and direct navigation as well as the happy-path click. A bookmarked detail view should explain itself even when the user never saw the dashboard.
If the summary covers the whole result set, distinguish that total from the number of rows on the current page. Virtualised rendering is purely presentational. Server-side pagination isn't quite: each page is a fresh query, so rows can shift between pages as data changes. Neither should quietly redefine the scope of an export or headline figure.
Make time an explicit input
'Due today' sounds simple until the service spans time zones or a business rule uses working days. Specify which time zone and calendar rule decide how each record is classified. Don't let the browser and the server each invent their own definition of 'now'.
For deterministic tests, provide a fixed clock and records immediately before, on and after the boundary. Include weekends or holidays only where the actual rule requires them. The expected population should be understandable without running the application.
A live view also needs a freshness policy. Decide how long a summary may remain unchanged, what triggers recalculation and whether a user can see when it was last updated. A 'Live' or 'Current' label should mean the data really is fresh, not just that the page is open.
Choose a consistency model for changing data
Two queries can observe different data even when their logic agrees. PostgreSQL's transaction-isolation documentation explains that under Read Committed, successive statements can see changes committed between them. A count and a detail query don't automatically describe one frozen moment. If they need to, run both in one statement, or in one Repeatable Read transaction on the same connection. Two separate API calls won't share a snapshot, whatever the isolation level.
Choose what the product needs. A financial export may require a consistent snapshot. A work queue may reasonably show the latest available state and explain that records changed since the summary was loaded. Don't end up promising both by accident.
For a snapshot-based view, give the snapshot a stable identity and use it for related reads. For a live queue, consider returning the recalculated total with the detail response and making it clear when the result has changed. The right choice depends on the decision the user is making, not on a general preference for stronger isolation.
React has its own idea of a snapshot, but it's a different thing: state and event handlers belong to a particular render, which says nothing about database consistency. When you're investigating a mismatch, treat interface state, server responses and stored records as separate layers.
Refresh the views affected by a change
When a user resolves a request, more than the open detail panel may change. The register, dashboard figure and any relevant grouped summary can all become stale. Define that set of affected views as part of the mutation's behaviour.
Tools such as TanStack Query support targeted query invalidation. Invalidation marks matching cached queries as stale and can refetch active queries. The application still needs to select the right keys and decide what users see while refreshed data arrives.
Handle a failed mutation explicitly. An optimistic display shouldn't leave the figure reduced after the server refuses the update. Preserve the user's context and explain whether the action failed, is still processing or completed elsewhere.
Where another user has changed the record, distinguish refreshing the display from authorising an overwrite. Showing current data doesn't by itself make a stale edit safe to apply.
Apply the same access boundary to both views
A summary must not count records the user isn't entitled to know exist. Apply the relevant access scope before aggregation and before returning detail records. Hiding rows in the browser is too late.
Test a restricted user, an empty population and records that straddle an access boundary. Also test a record changing state between the summary and the click. For each case, check the explanation shown to the user alongside the returned identifiers.
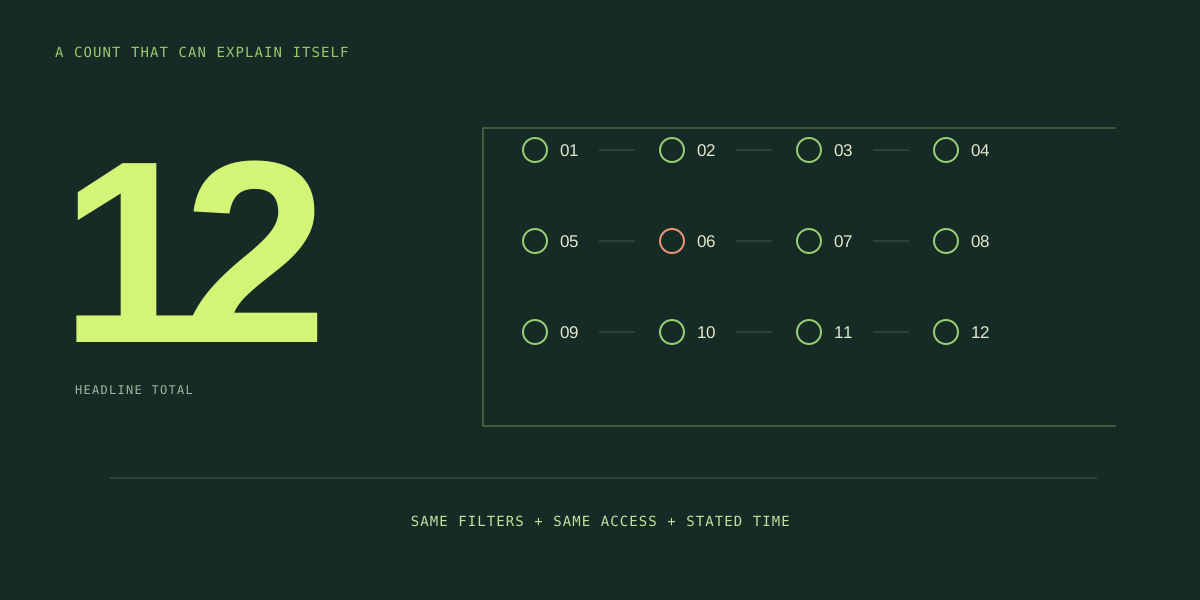
The most useful acceptance test is relational: under a stated clock, scope and data version, the summary count equals the complete detail population. When live changes make that equality temporary, the interface should explain why. Get that right and the dashboard becomes somewhere people start work, not another set of numbers to argue about.